Monitoring Stocks with Grafana
This is a post showing how to use the graph builder grafana and a python script to monitor stocks.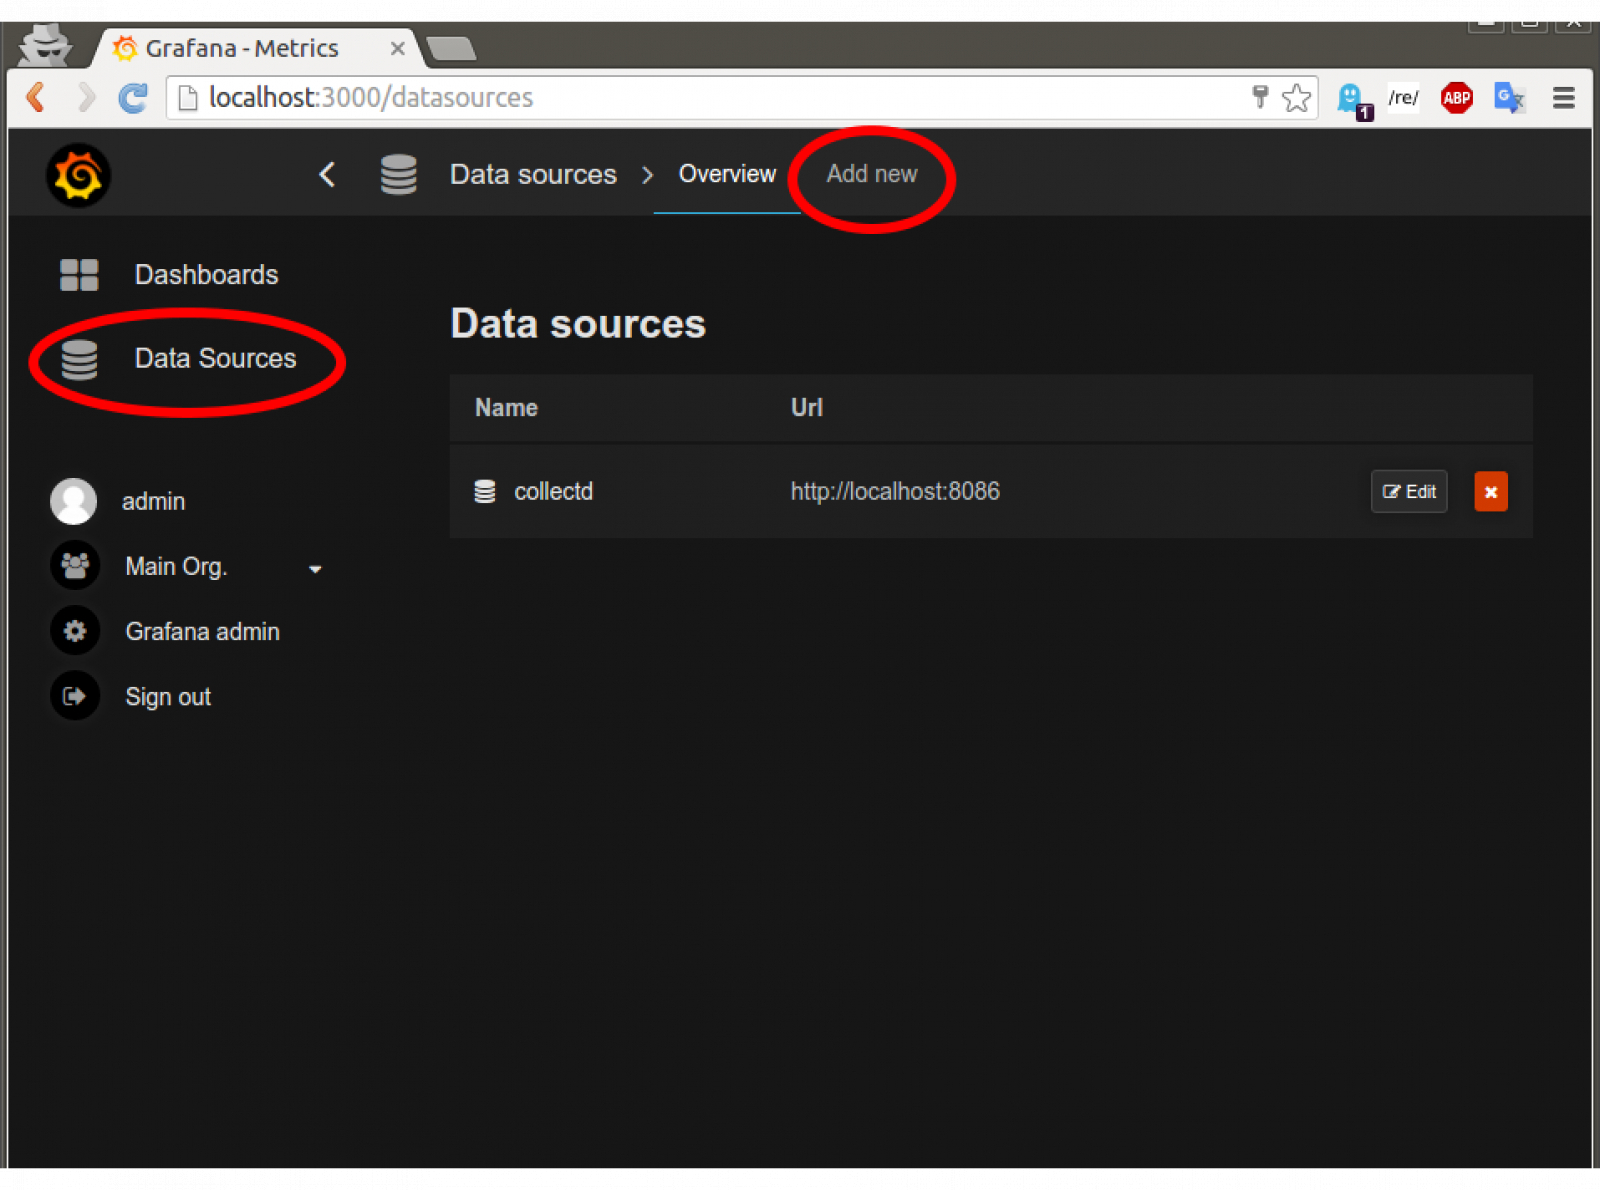 Now, fill out the information as follows:
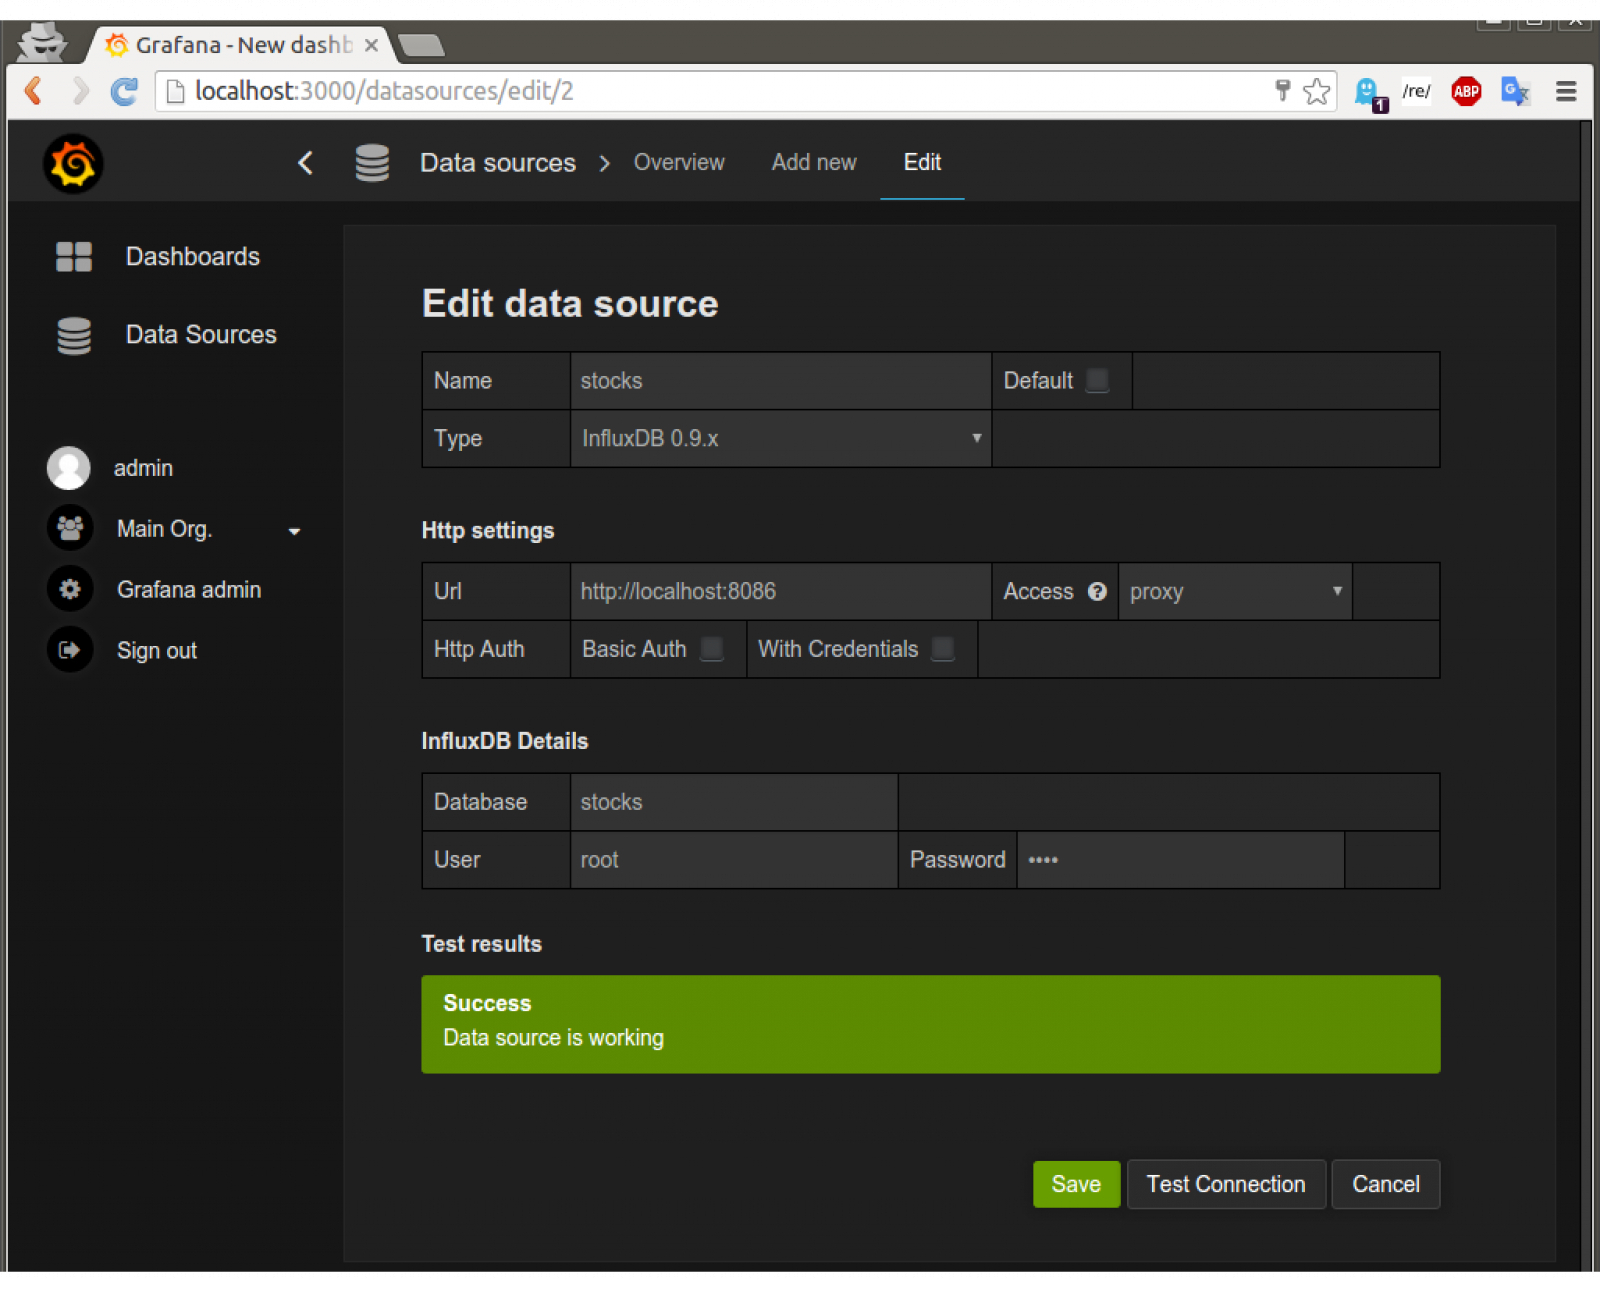 (the password is "root" )Click "Test Connection" to verify it works then click "Save" and you should be ready to go.Now, make a python script and put the following in:and create a json file called "stocks.json" and put this in it:The python script uses a module called googlefinance ("sudo pip install googlefinance" if not installed) to read the stock's values listed in the "stocks.json" file and writes the data to influxdb using it's REST api.Run the python script, go back to influxdb's admin page (localhost:8083), click on the dropdown menu on the top-right of the page (It should say "Database: _internal") and select the "stocks" database. Then run the query "select * from stock_value" and you should see some stock values listed.
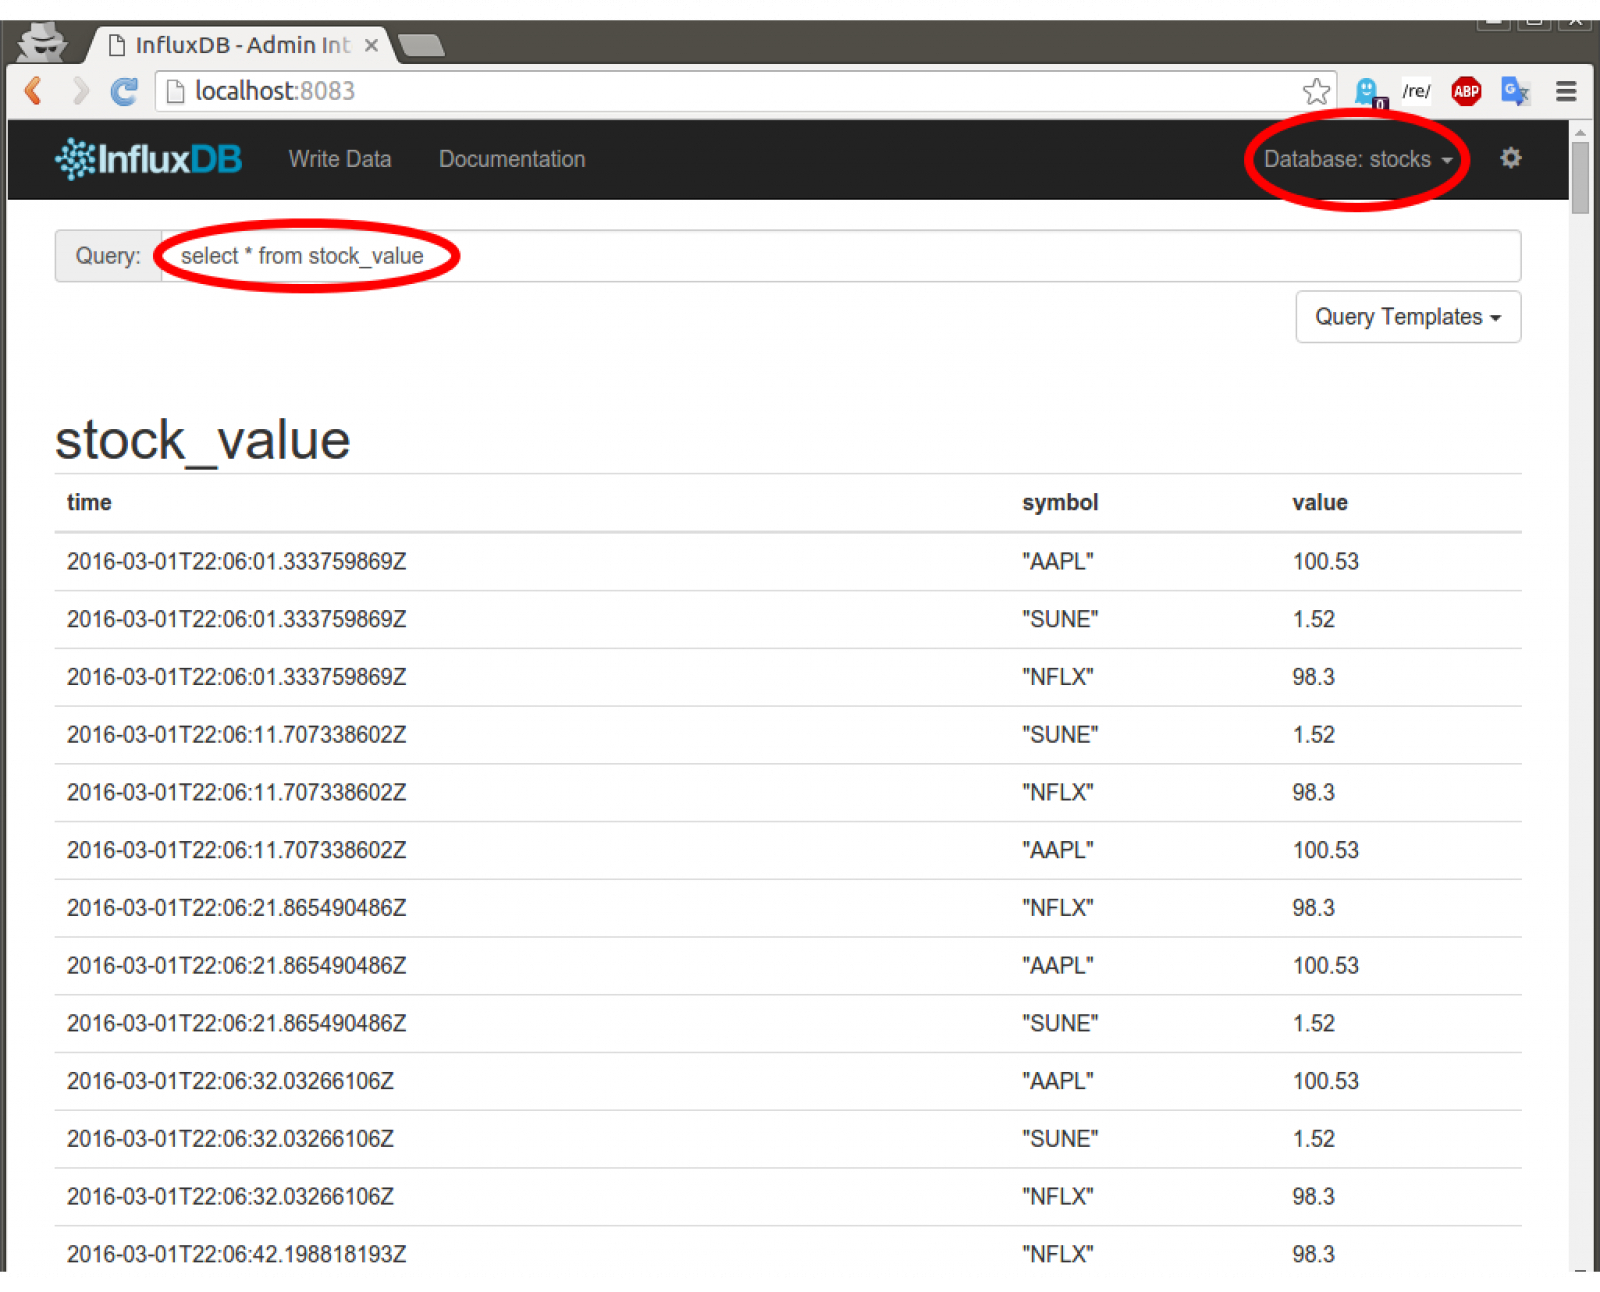
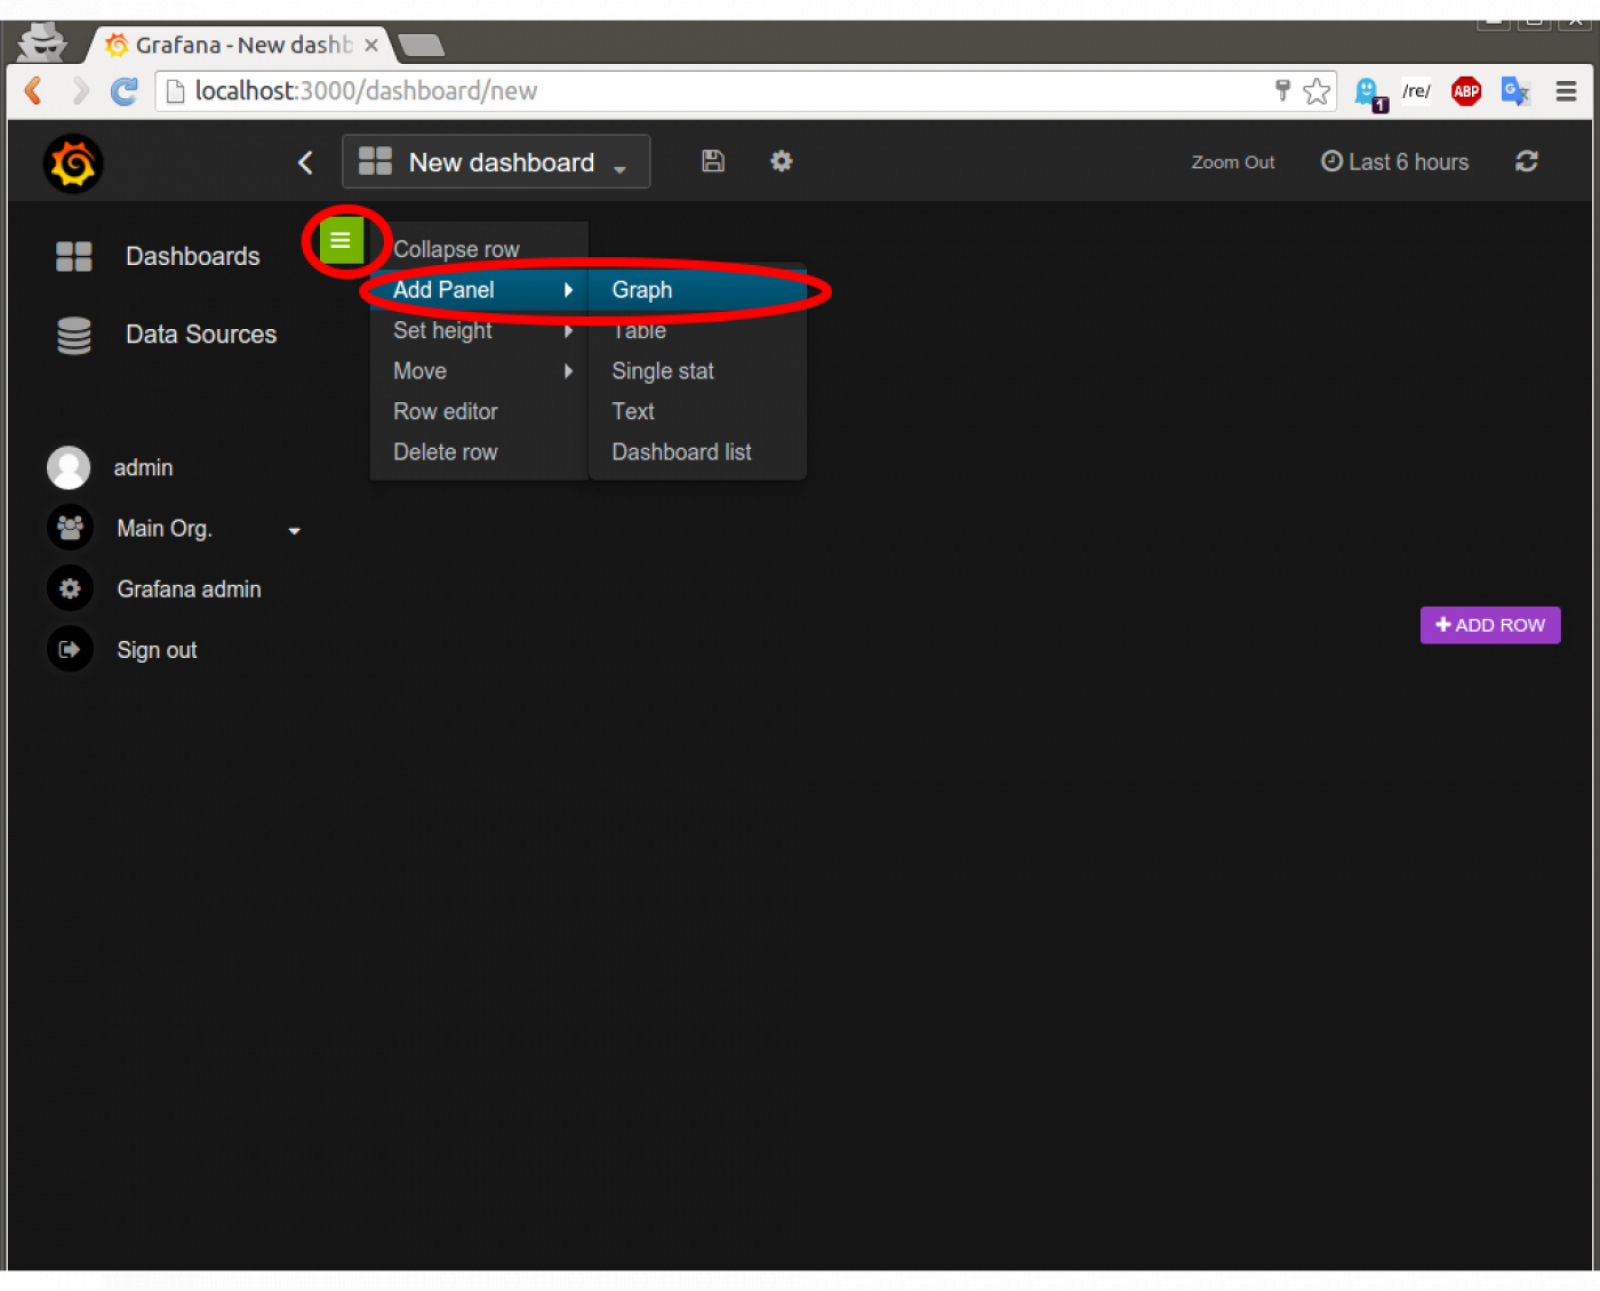 ...and you should see data points plotted.
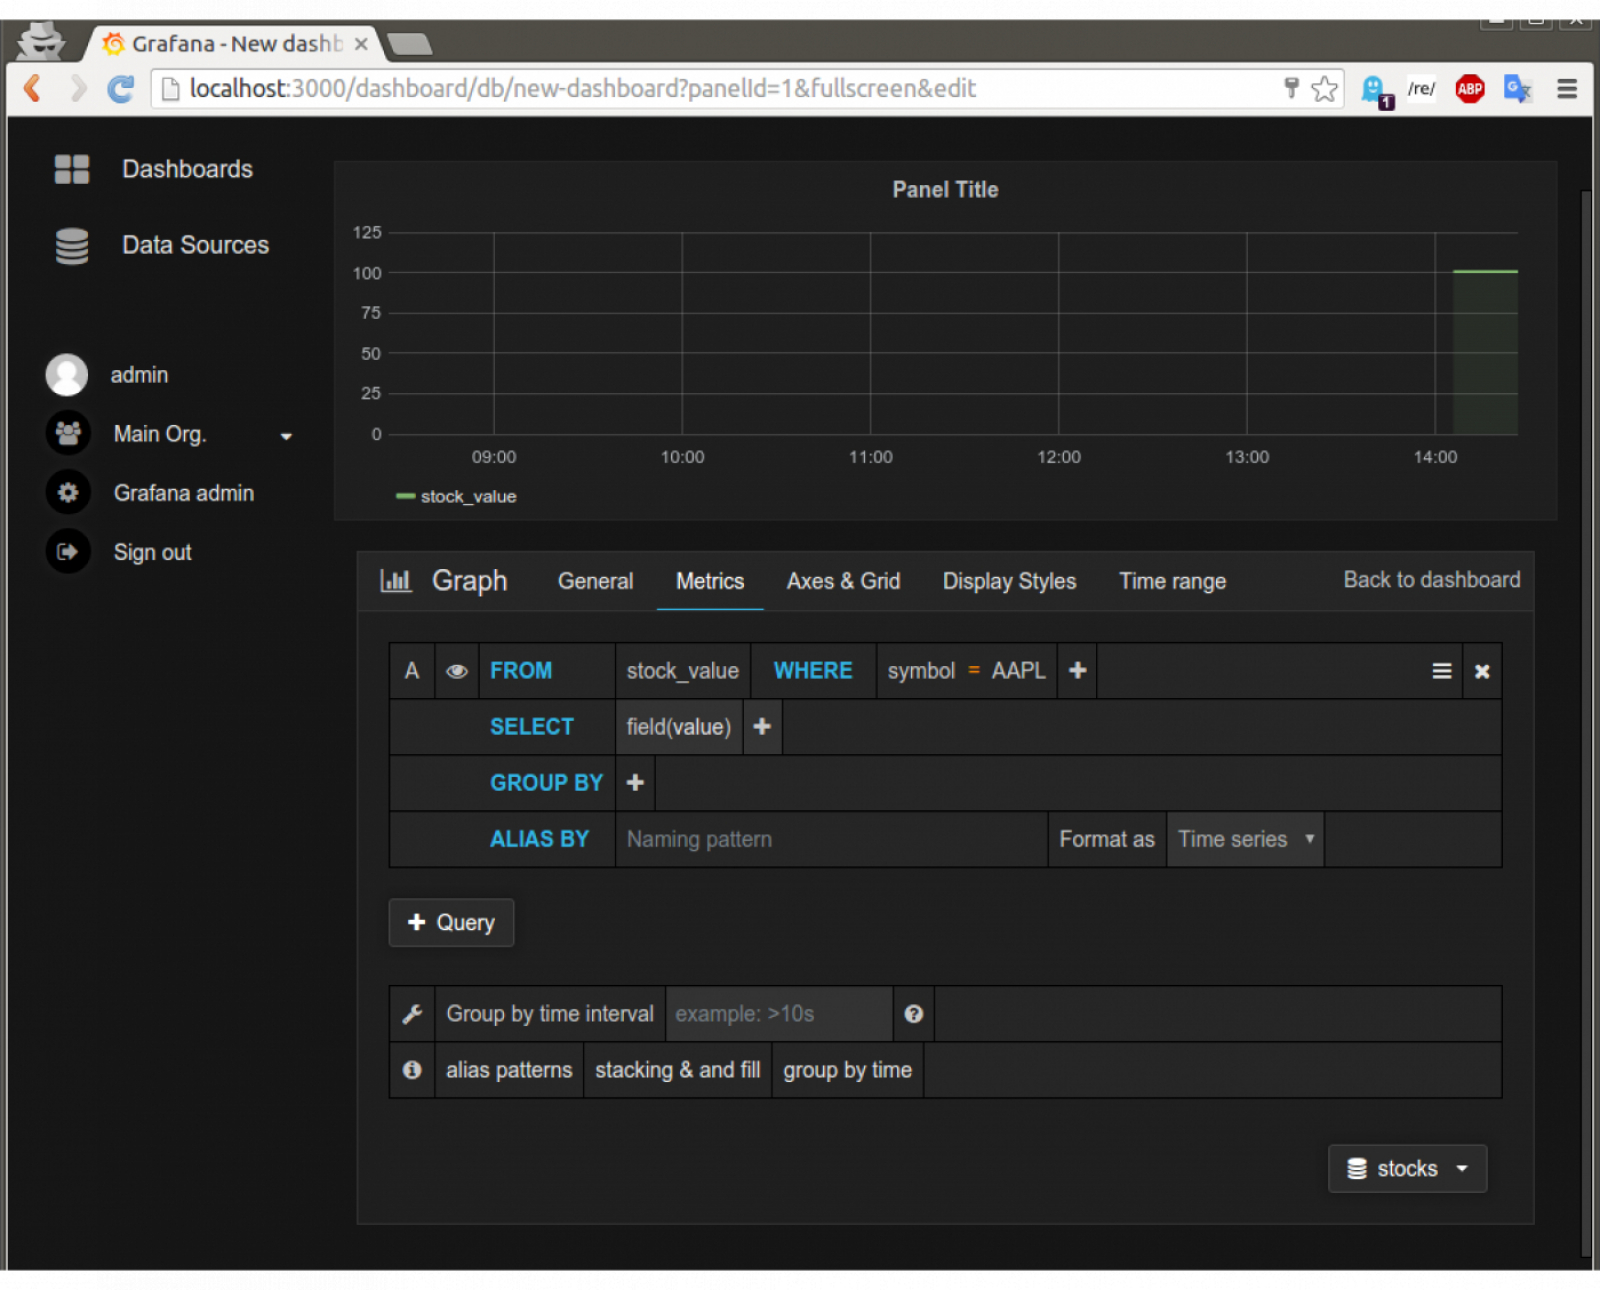 Now, you are able to use grafana's powerful dashboard interface to plot stocks the way you want.
Get your packages ready
First things first, download and install [urll=http://grafana.org/download/]grafana[/url] and influxdb.You can check to see if they installed correctly and are running by going to localhost:8083 and localhost:3000 in your browser for influxdb and grafana respectively.Begin Configuring
Go to the influxdb admin page (localhost:8083). Inside the text box, type "CREATE DATABASE `stocks` " and hit enter. You should see a green box with "Success" in it.Next, go to the grafana page (localhost:3000) and log in using "admin" for both username and password, then select "Database Sources" then "Add new"import json
from googlefinance import getQuotes
import requests
from time import sleep
class Main():
def __init__(self, db="stocks", stocks_file="stocks.json"):
self.stocks=None
self.db=db
self.load_stocks(stocks_file)
def write_to_db(self, measurement, tags, values):
tag_string=["".join(["{}={}".format(k,v) for k,v in t.iteritems()]) for t in tags]
data_string="
".join(["{},{} value={}".format(measurement, tag_string[i], values[i]) for i in range(len(values))])
requests.post("http://localhost:8086/write?db={}".format(self.db), data_string)
def get_stock_prices(self, stocks):
quotes_json=getQuotes(stocks)
quotes={q["StockSymbol"]:q["LastTradePrice"] for q in quotes_json}
return quotes
def load_stocks(self, stocks_file):
with open(stocks_file) as f:
data=json.load(f)
self.stocks=data['stocks']
def run(self, interval=10):
while 1:
try:
sleep(interval)
stock_prices=self.get_stock_prices(self.stocks)
self.write_to_db("stock_value", [{"symbol":k} for k in stock_prices.keys()], stock_prices.values())
except KeyboardInterrupt:
quit()
except:
pass
if __name__=="__main__":
m=Main()
m.run(){"stocks": ["SUNE", "AAPL", "NFLX"]}Plot!
Next, go back to grafana, create a new dashboard.